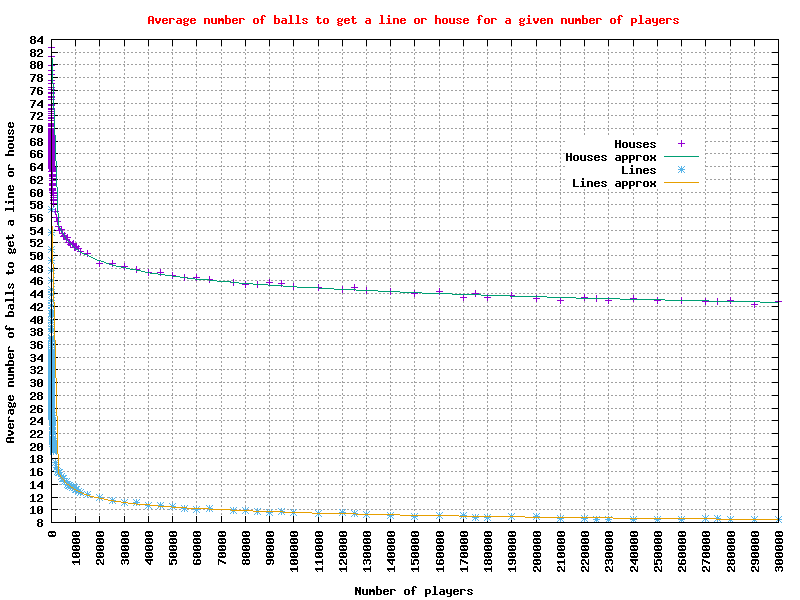
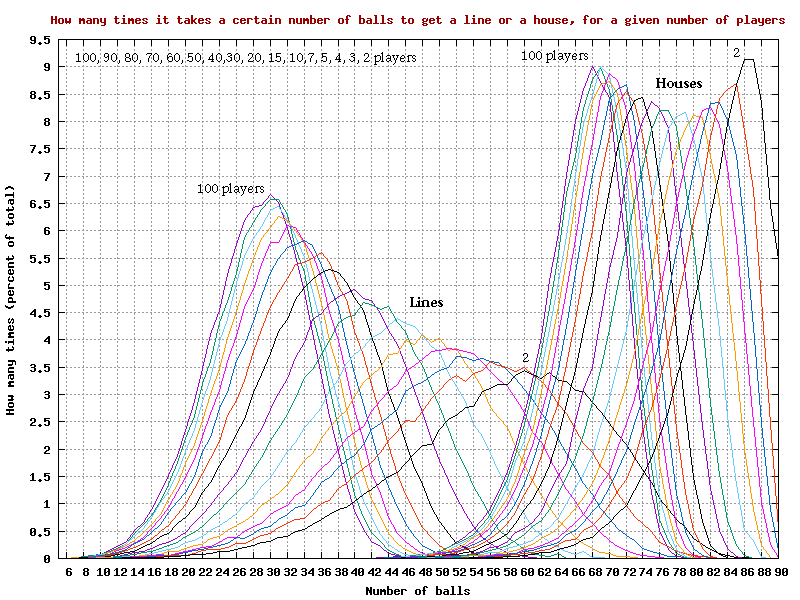
How many times it takes a certain number of balls to get a “line” or a “house”, for a given number of players
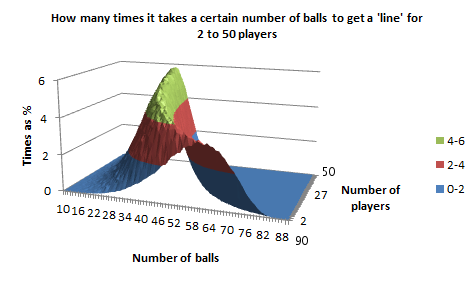
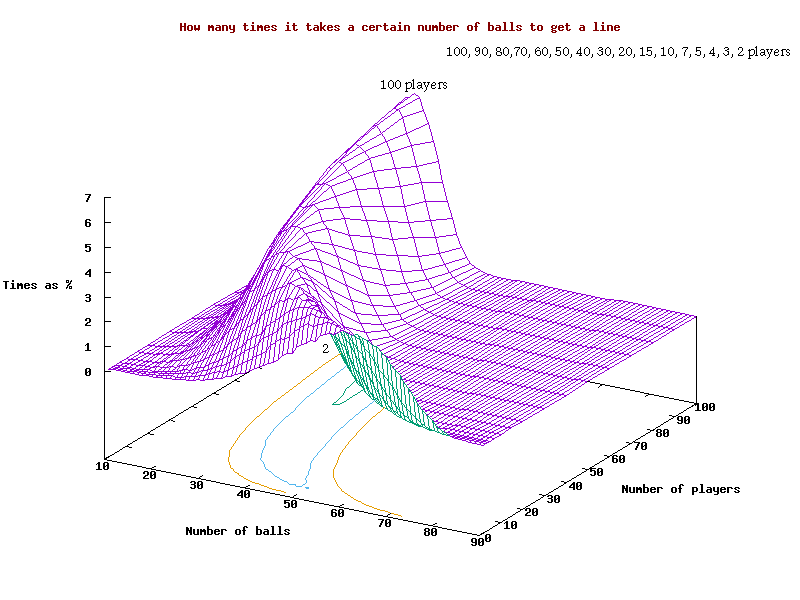
Graph of how many times it takes a certain number of balls to get a “line”, for a given number of players, in 3D, as a surface chart in Excel
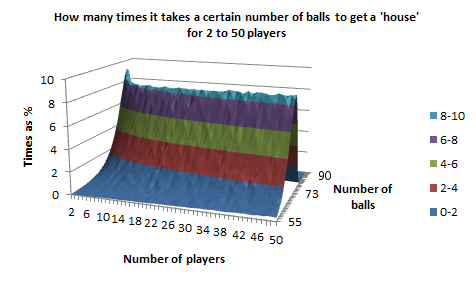
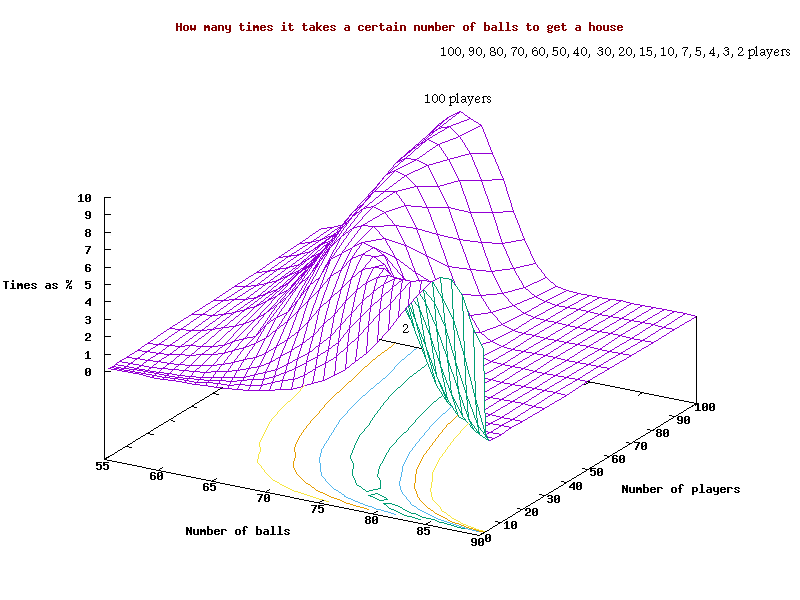
Graph of how many times it takes a certain number of balls to get a “house”, for a given number of players, in 3D, as a surface chart in Excel
Graph of how many times it takes a certain number of balls to get a “line” or a “house”, for a given number of players
Graph of how many times it takes a certain number of balls to get a “line”, for a given number of players, in 3D
Graph of how many times it takes a certain number of balls to get a “house”, for a given number of players, in 3D
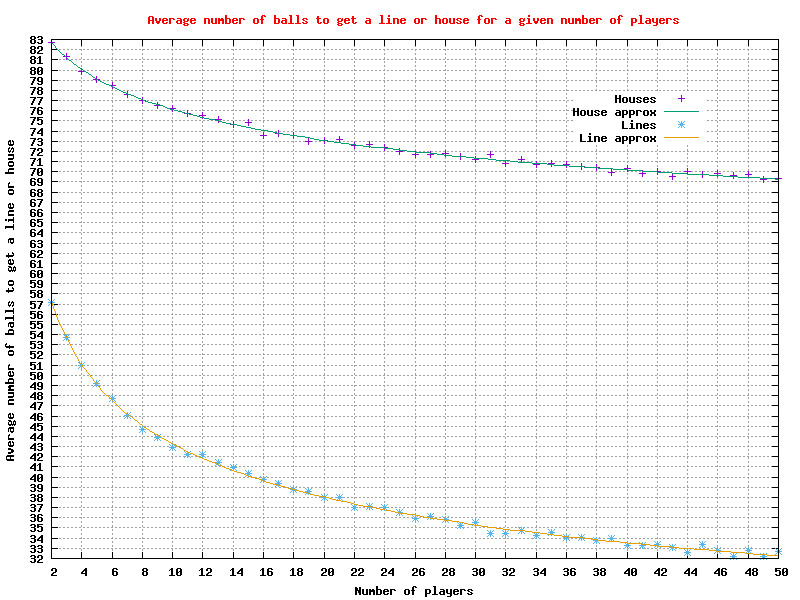
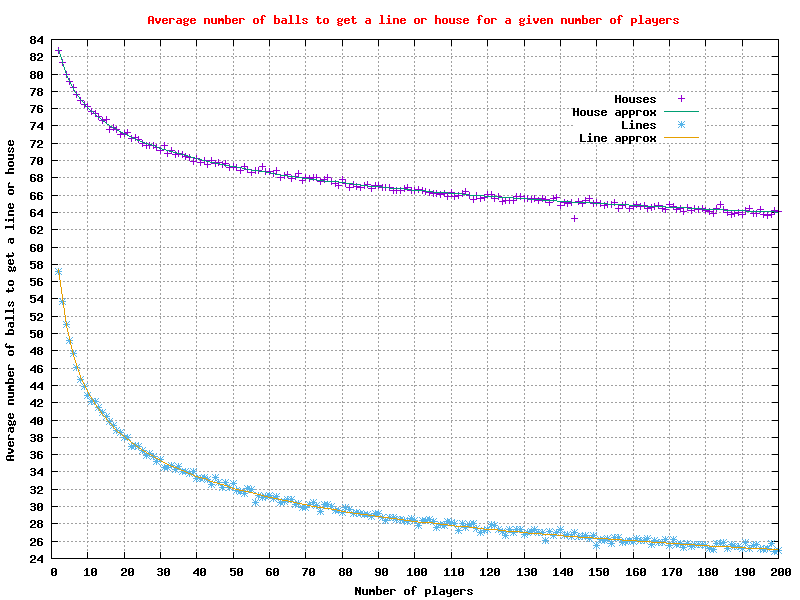
Average number of balls to get a “line” and “house” for a range of number of players
Graph of the average number of balls to get a “line” or “house” for 2 to 50 players
Graph of the average number of balls to get a “line” or “house” for 2 to 200 players
Graph of the average number of balls to get a “line” or “house” for 2 to 300,000 players
