1 How many times it takes a certain number of balls to get a “line” or a “house”, for a given number of players
Graph of how many times it takes a certain number of balls to get a “line” or a “house”, for a given number of players
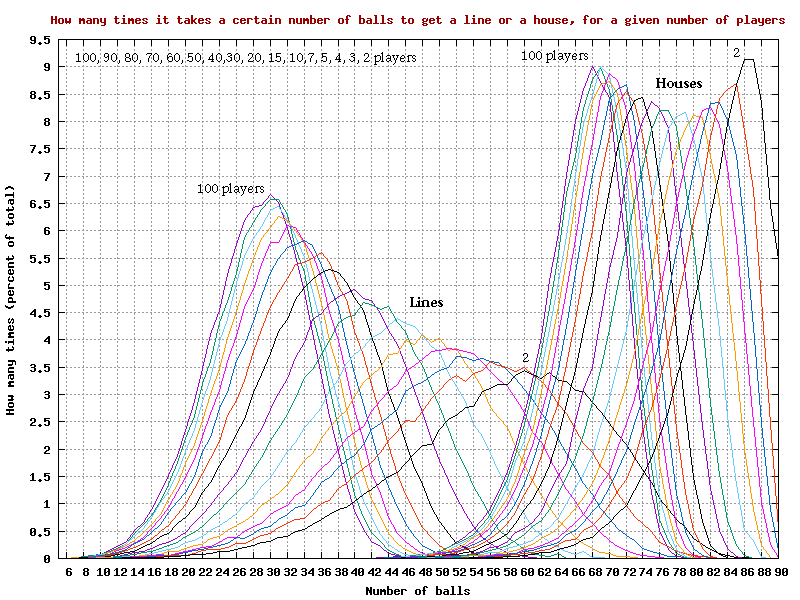
1.1 Introduction
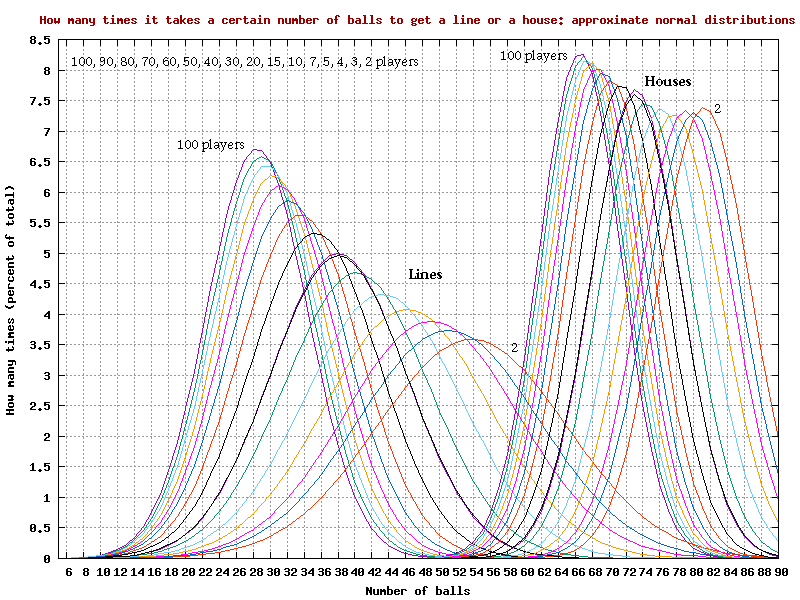
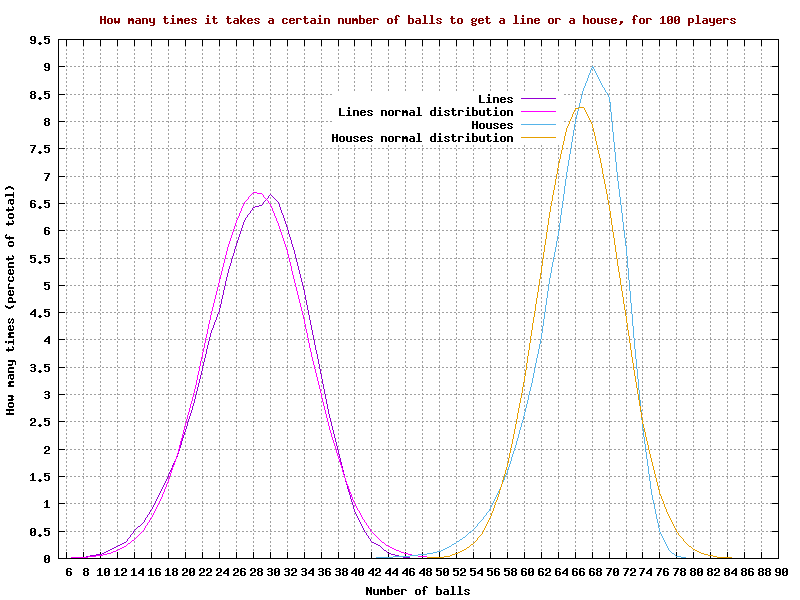
1.2 Graph of how many times it takes a certain number of balls to get a “line” or a “house”, for a given number of players, showing approximate normal distributions
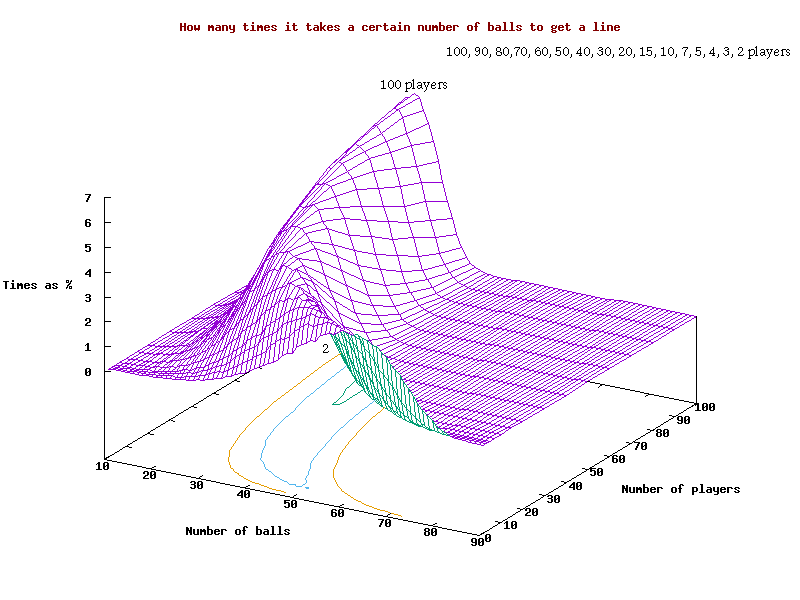
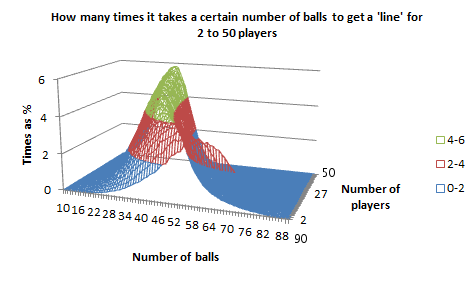
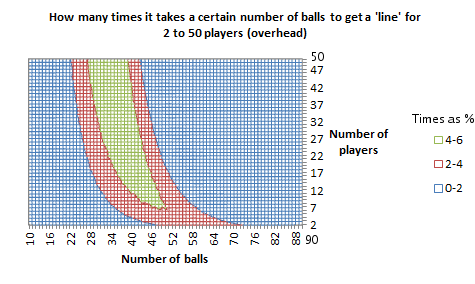
Graphs of how many times it takes a certain number of balls to get a “line”, for a given number of players, in 3D
1.3 Graphs of how many times it takes a certain number of balls to get a “line”, for a given number of players, in 3D, as charts in Excel

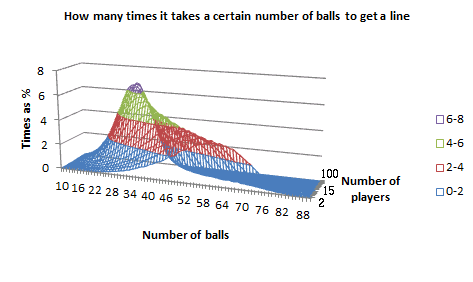

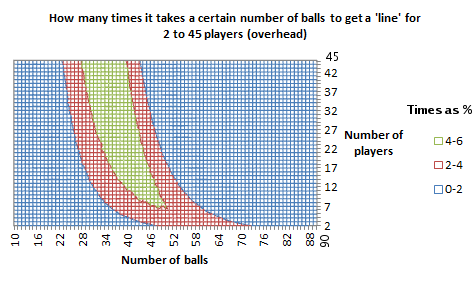
The scale on the players/depth/z axis on the above 4 graphs is 2, 3, 4, 5, 7, 10, 15, 20, 30, 40, 50, 70, 80, 90, 100, equally spaced
There is a CSV file with the data for the above 4 Excel graphs formatted for the Excel spreadsheet
There is a CSV file with the data for the above 4 Excel graphs formatted for the Excel spreadsheet:


There is a CSV file with the data for the above 4 Excel graphs formatted for the Excel spreadsheet
There is a CSV file with the data for the above 4 Excel graphs formatted for the Excel spreadsheet:
Graphs of how many times it takes a certain number of balls to get a “house”, for a given number of players, in 3D
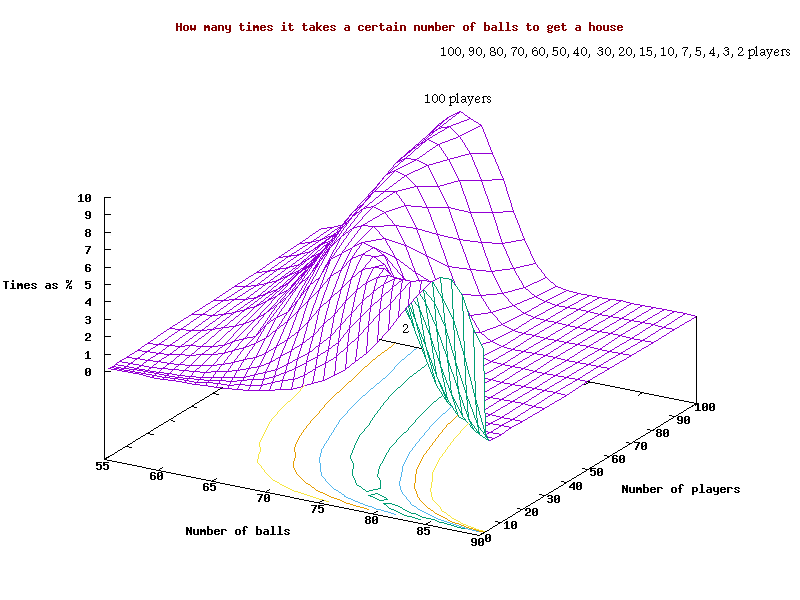
1.4 Graphs of how many times it takes a certain number of balls to get a “house”, for a given number of players, in 3D, as charts in Excel

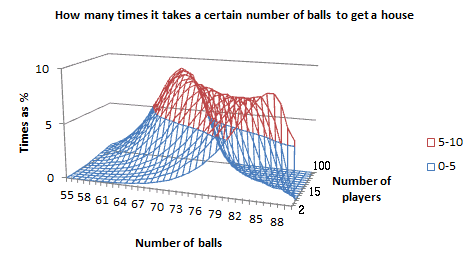

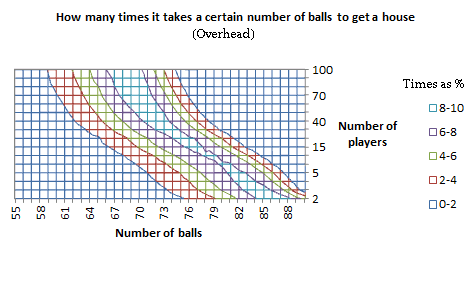
The scale on the players/depth/z axis on the above 4 graphs is 2, 3, 4, 5, 7, 10, 15, 20, 30, 40, 50, 70, 80, 90, 100, equally spaced
There is a CSV file with the data for the above 4 Excel graphs formatted for the Excel spreadsheet
There is a CSV file with the data for the above 4 Excel graphs formatted for the Excel spreadsheet:


There is a CSV file with the data for the above 4 Excel graphs formatted for the Excel spreadsheet
There is a CSV file with the data for the above 4 Excel graphs formatted for the Excel spreadsheet:
1.5 Graphs of how many times it takes a certain number of balls to get a “line” or a “house”, for a given number of players
Graph of how many times it takes a certain number of balls to get a “line” or a “house”, for 2 players
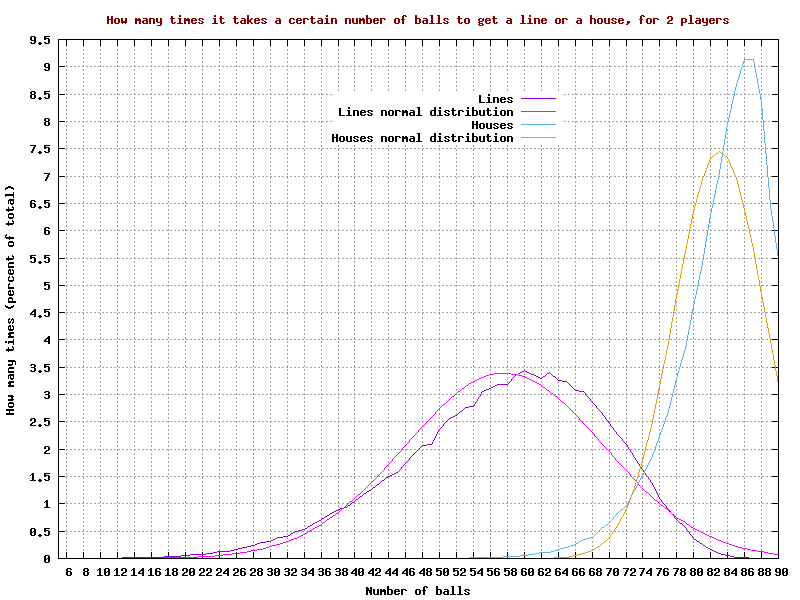
There are CSV files with the data for the “lines” and “houses”
There is a CSV file with the data for the “lines”:
There is a CSV file with the data for the “houses”:
Graph of how many times it takes a certain number of balls to get a “line” or a “house”, for 3 players
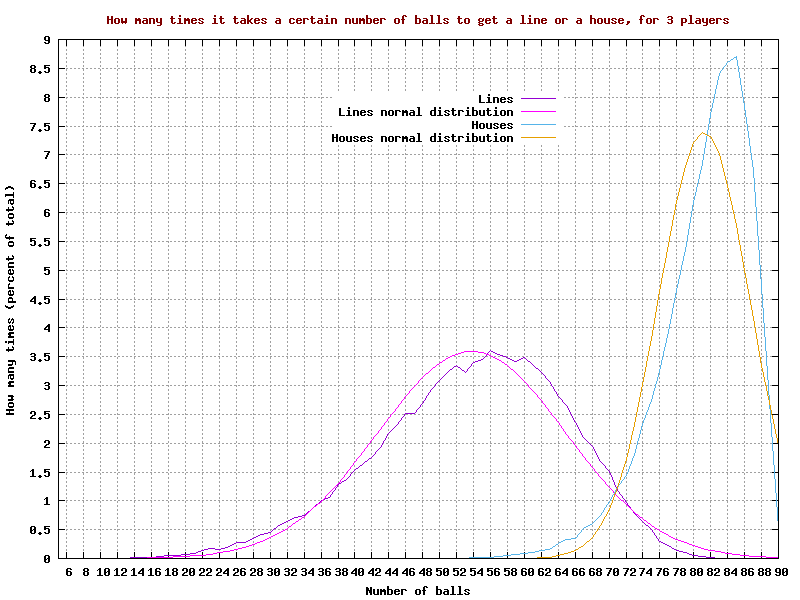
There are CSV files with the data for the “lines” and “houses”
There is a CSV file with the data for the “lines”:
There is a CSV file with the data for the “houses”:
Graph of how many times it takes a certain number of balls to get a “line” or a “house”, for 4 players
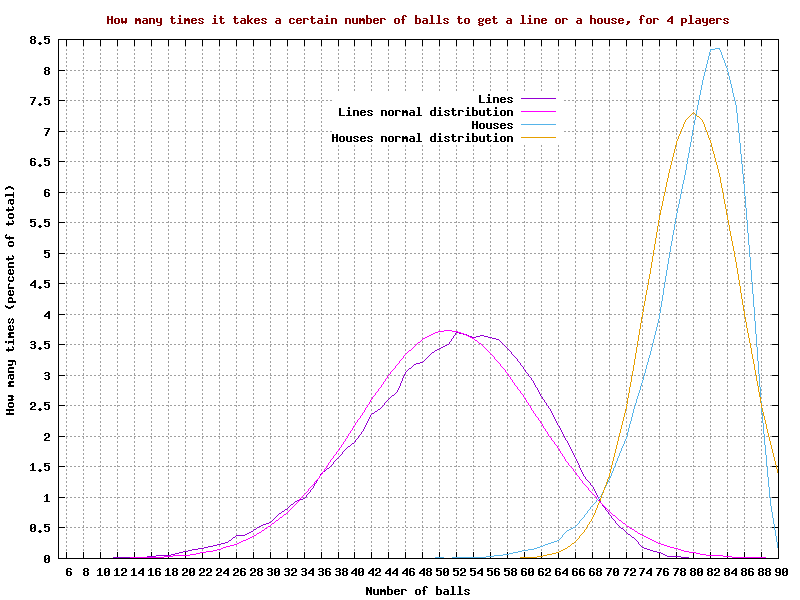
There are CSV files with the data for the “lines” and “houses”
There is a CSV file with the data for the “lines”:
There is a CSV file with the data for the “houses”:
Graph of how many times it takes a certain number of balls to get a “line” or a “house”, for 5 players
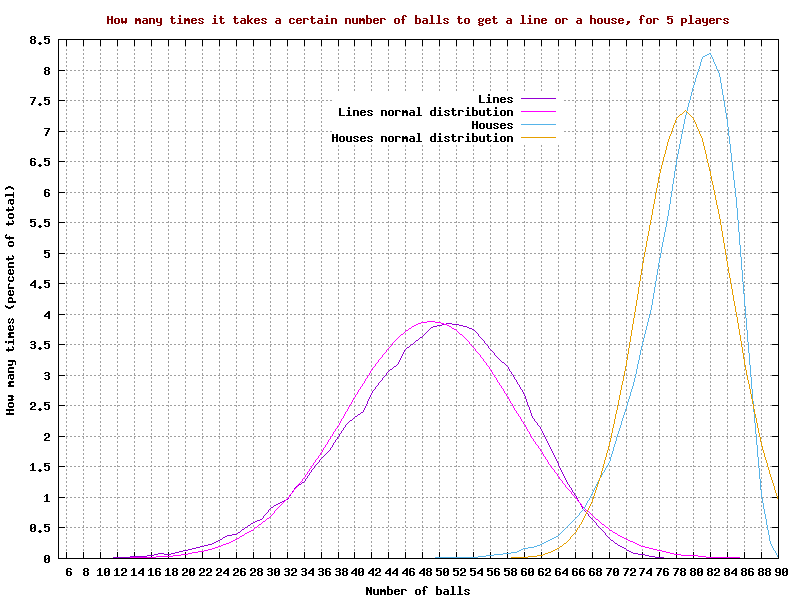
There are CSV files with the data for the “lines” and “houses”
There is a CSV file with the data for the “lines”:
There is a CSV file with the data for the “houses”:
Graph of how many times it takes a certain number of balls to get a “line” or a “house”, for 7 players
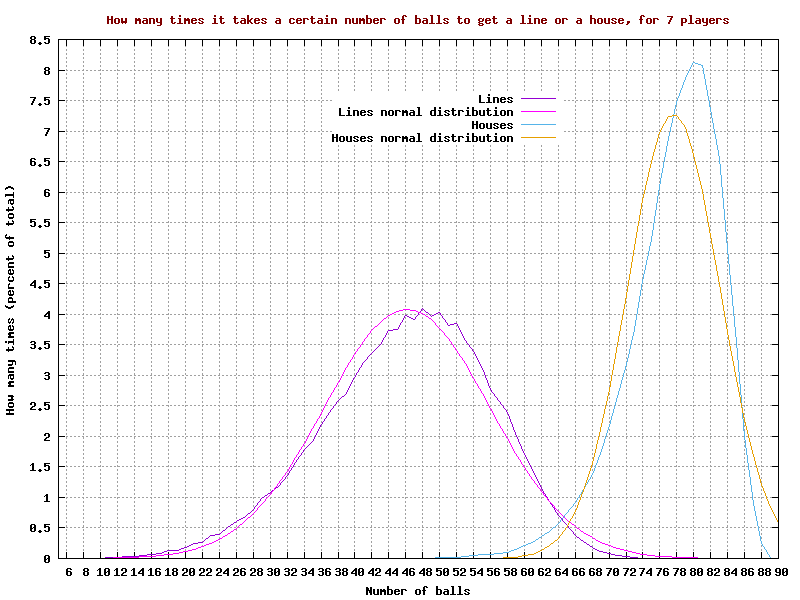
There are CSV files with the data for the “lines” and “houses”
There is a CSV file with the data for the “lines”:
There is a CSV file with the data for the “houses”:
Graph of how many times it takes a certain number of balls to get a “line” or a “house”, for 10 players
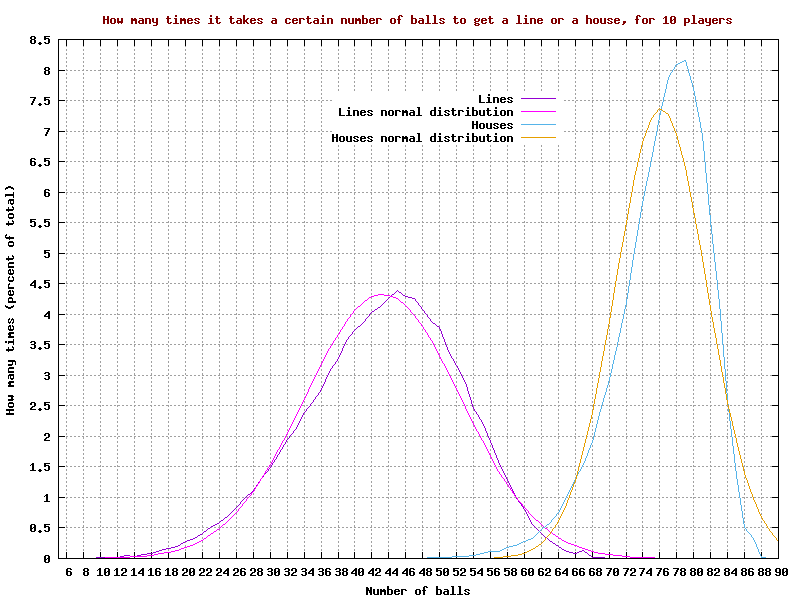
There are CSV files with the data for the “lines” and “houses”
There is a CSV file with the data for the “lines”:
There is a CSV file with the data for the “houses”:
Graph of how many times it takes a certain number of balls to get a “line” or a “house”, for 15 players
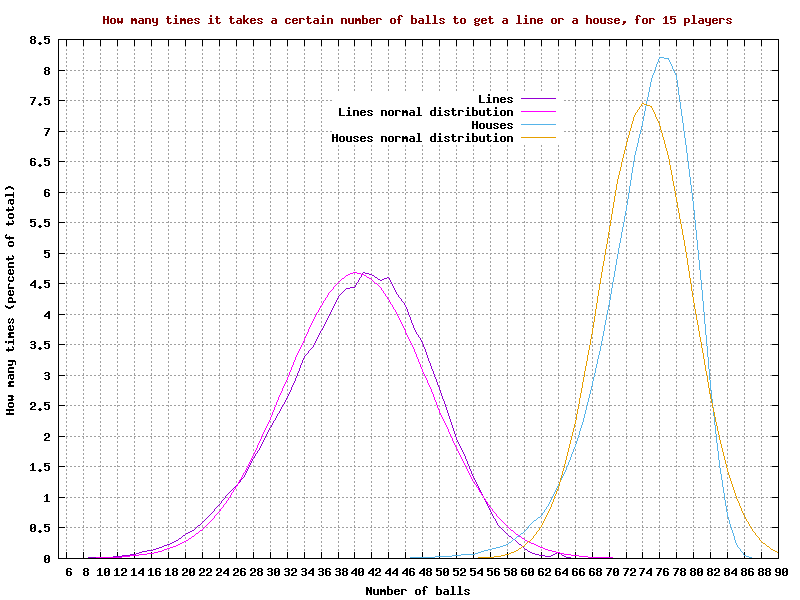
There are CSV files with the data for the “lines” and “houses”
There is a CSV file with the data for the “lines”:
There is a CSV file with the data for the “houses”:
Graph of how many times it takes a certain number of balls to get a “line” or a “house”, for 20 players
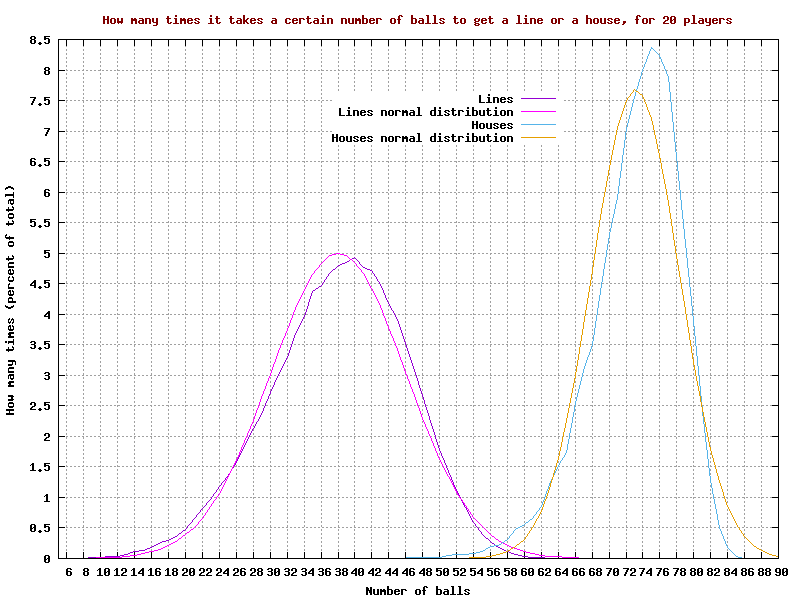
There are CSV files with the data for the “lines” and “houses”
There is a CSV file with the data for the “lines”:
There is a CSV file with the data for the “houses”:
Graph of how many times it takes a certain number of balls to get a “line” or a “house”, for 25 players
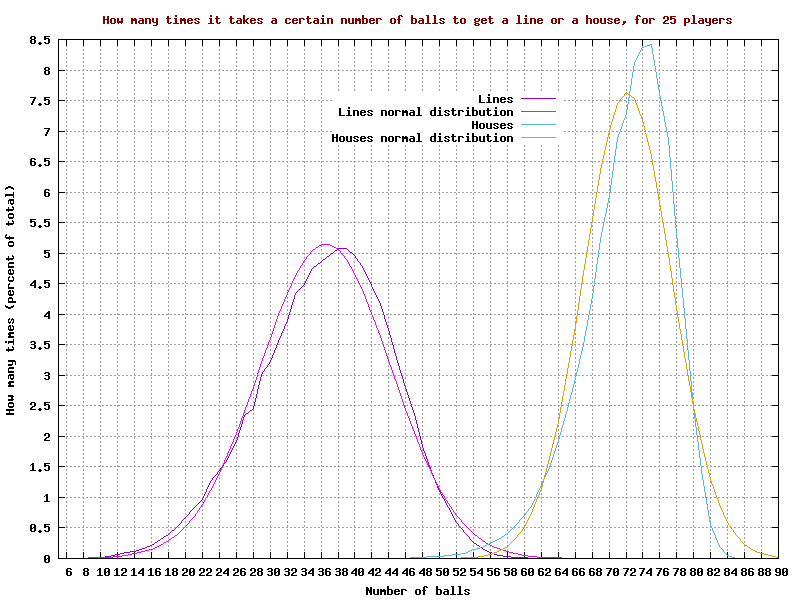
There are CSV files with the data for the “lines” and “houses”
There is a CSV file with the data for the “lines”:
There is a CSV file with the data for the “houses”:
Graph of how many times it takes a certain number of balls to get a “line” or a “house”, for 30 players
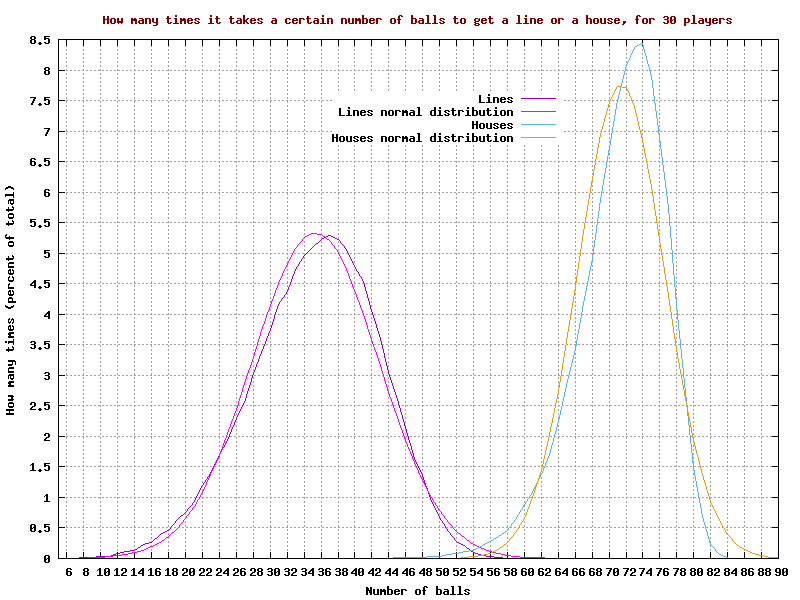
There are CSV files with the data for the “lines” and “houses”
There is a CSV file with the data for the “lines”:
There is a CSV file with the data for the “houses”:
Graph of how many times it takes a certain number of balls to get a “line” or a “house”, for 40 players
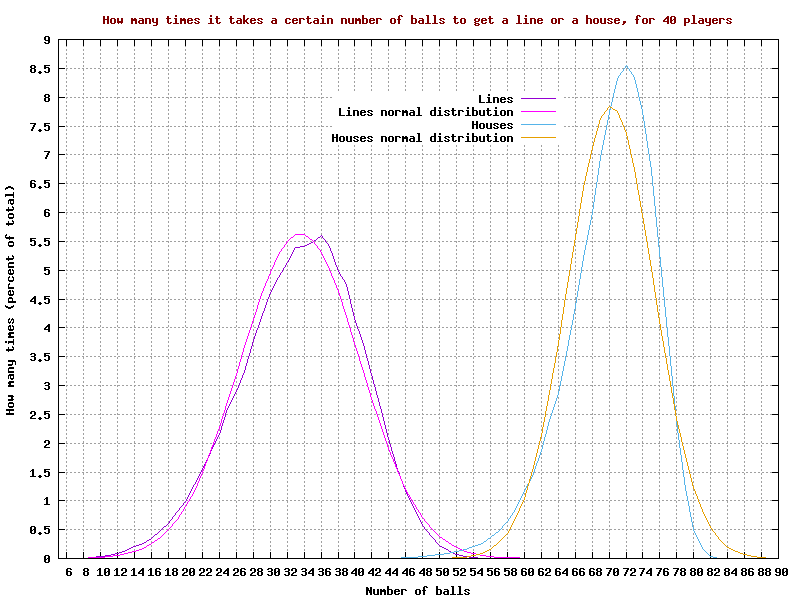
There are CSV files with the data for the “lines” and “houses”
There is a CSV file with the data for the “lines”:
There is a CSV file with the data for the “houses”:
Graph of how many times it takes a certain number of balls to get a “line” or a “house”, for 50 players
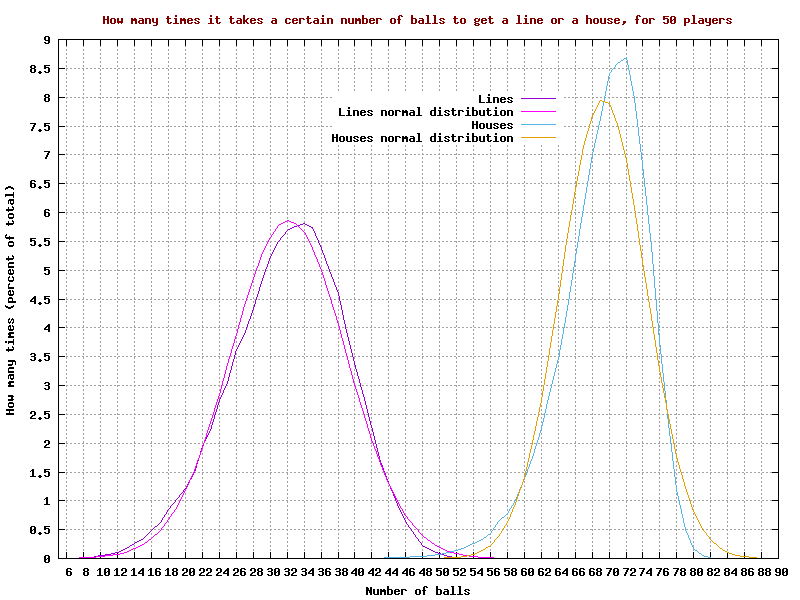
There are CSV files with the data for the “lines” and “houses”
There is a CSV file with the data for the “lines”:
There is a CSV file with the data for the “houses”:
Graph of how many times it takes a certain number of balls to get a “line” or a “house”, for 60 players

There are CSV files with the data for the “lines” and “houses”
There is a CSV file with the data for the “lines”:
There is a CSV file with the data for the “houses”:
Graph of how many times it takes a certain number of balls to get a “line” or a “house”, for 70 players

There are CSV files with the data for the “lines” and “houses”
There is a CSV file with the data for the “lines”:
There is a CSV file with the data for the “houses”:
Graph of how many times it takes a certain number of balls to get a “line” or a “house”, for 80 players

There are CSV files with the data for the “lines” and “houses”
There is a CSV file with the data for the “lines”:
There is a CSV file with the data for the “houses”:
Graph of how many times it takes a certain number of balls to get a “line” or a “house”, for 90 players

There are CSV files with the data for the “lines” and “houses”
There is a CSV file with the data for the “lines”:
There is a CSV file with the data for the “houses”:
Graph of how many times it takes a certain number of balls to get a “line” or a “house”, for 100 players
There are CSV files with the data for the “lines” and “houses”
There is a CSV file with the data for the “lines”:
There is a CSV file with the data for the “houses”:
There is a file with the raw data for the above graphs together with the scripts used to total that data
There is a file with the raw data for the above graphs together with the scripts used to total that data:
2 Average number of balls to get a “line” and “house” for a range of number of players
Graph of the average number of balls to get a “line” for 2 to 50 players
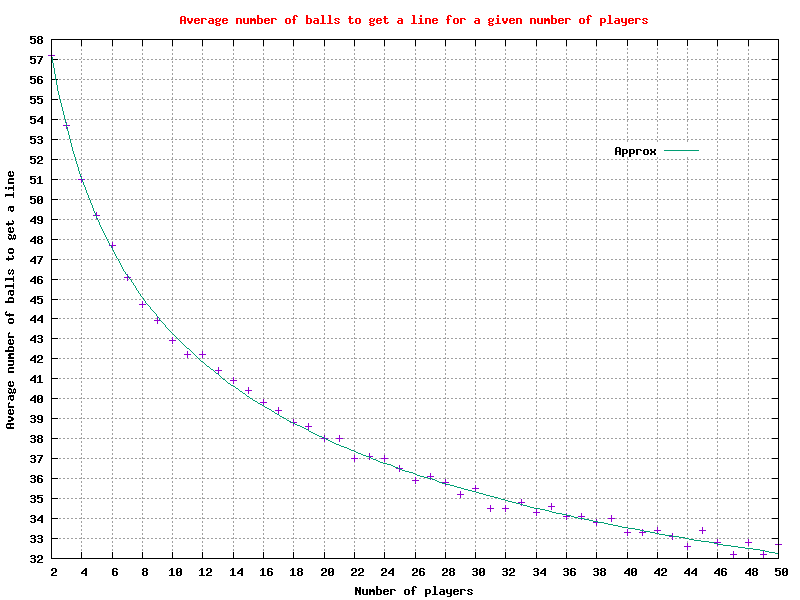
Approximation for 2 to 50 players for line
| Constant | Value |
|---|---|
| a | 92.11309 |
| b | 0.4841813 |
| c | 2.526737 |
| d | 18.16825 |
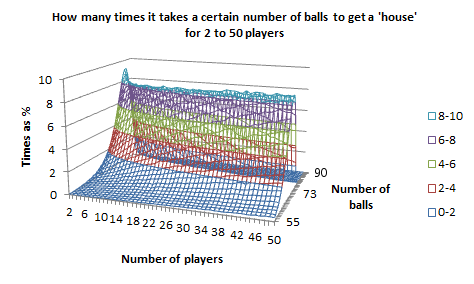
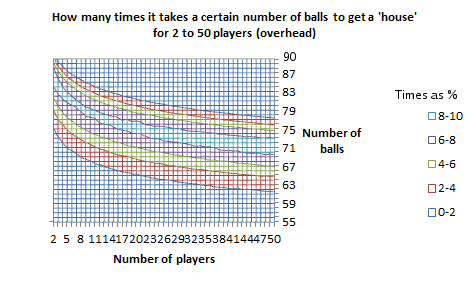
Graph of the average number of balls to get a “house” for 2 to 50 players
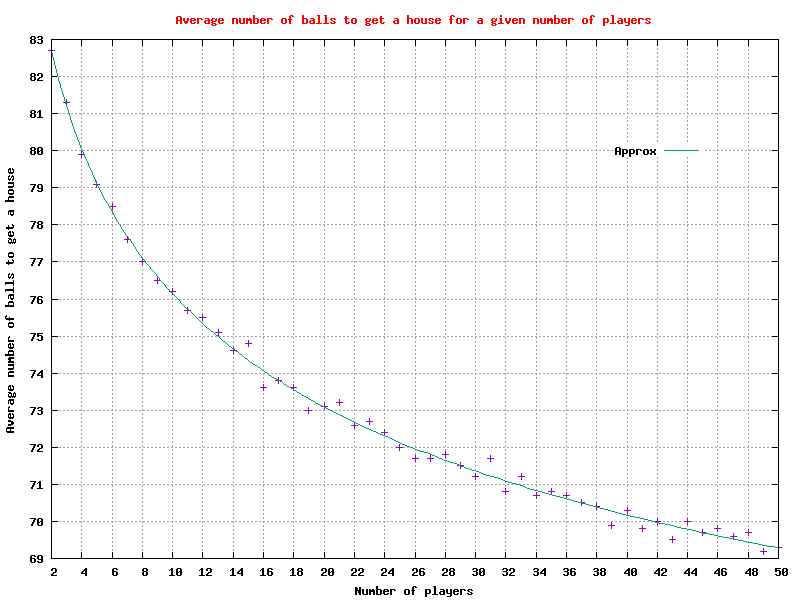
Approximation for 2 to 50 players for house
| Constant | Value |
|---|---|
| a | 92.8501 |
| b | 0.4983197 |
| c | 12.43463 |
| d | 57.50341 |
2.1 Graphs of the average number of balls to get a “line” or “house” for 2 to 200 and 300,000 players
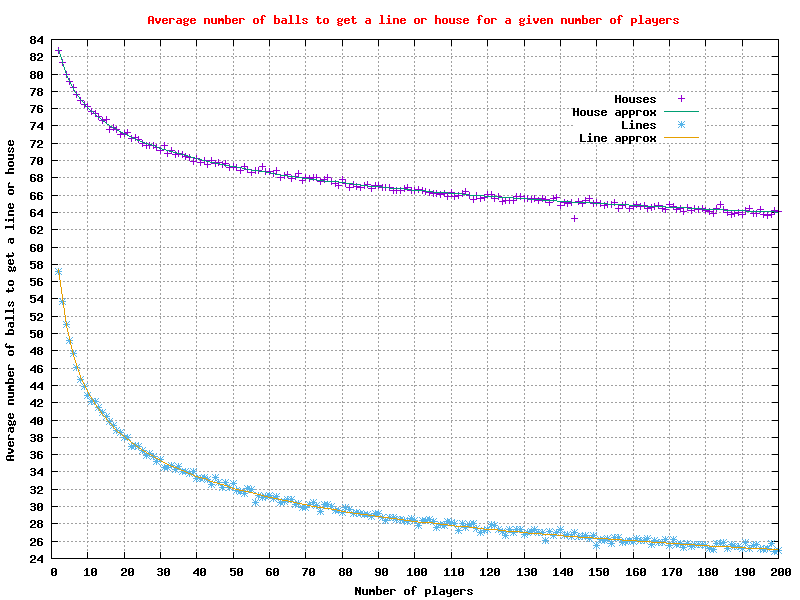
Graph of the average number of balls to get a “line” for 2 to 200 players
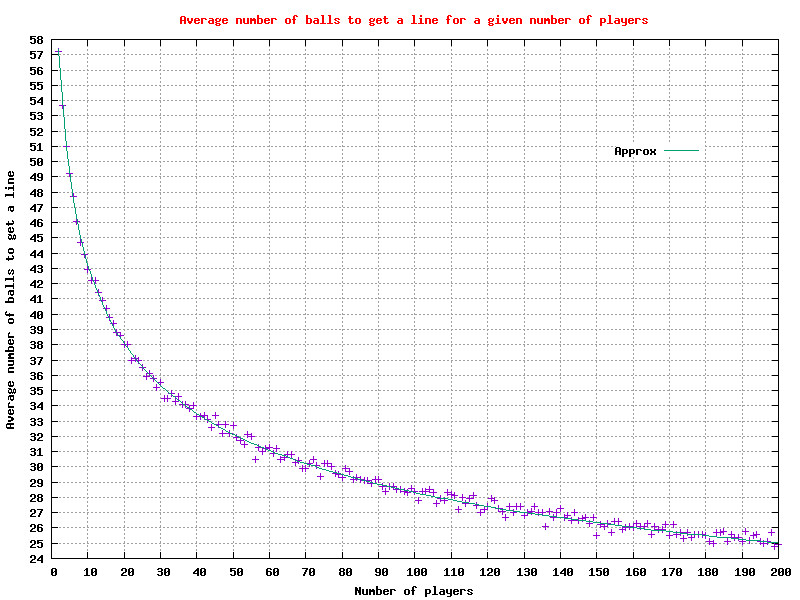
Approximation for 2 to 200 players for line
| Constant | Value |
|---|---|
| a | 145.1422 |
| b | 0.3053657 |
| c | 0.2895424 |
| d | 8.711613 |
Graph of the average number of balls to get a “house” for 2 to 200 players
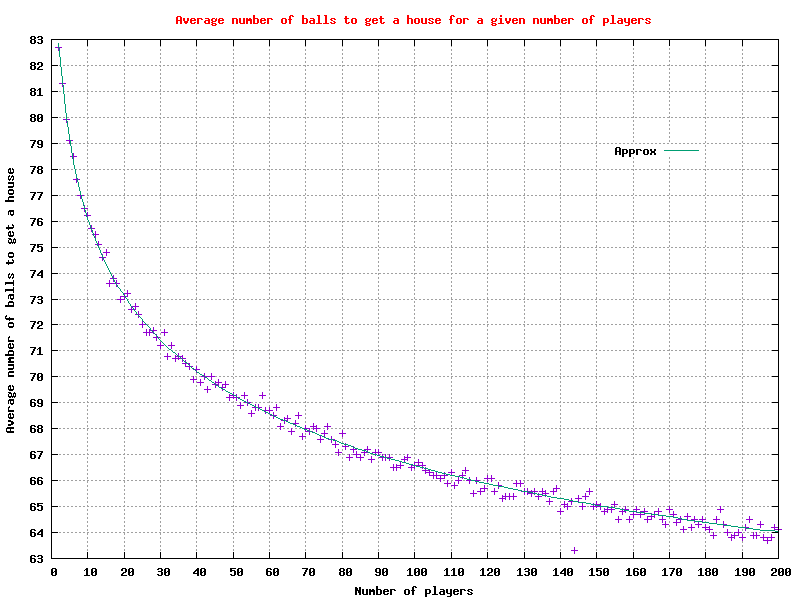
Approximation for 2 to 200 players for house
| Constant | Value |
|---|---|
| a | 103.4377 |
| b | 0.3104399 |
| c | 10.74819 |
| d | 48.12477 |
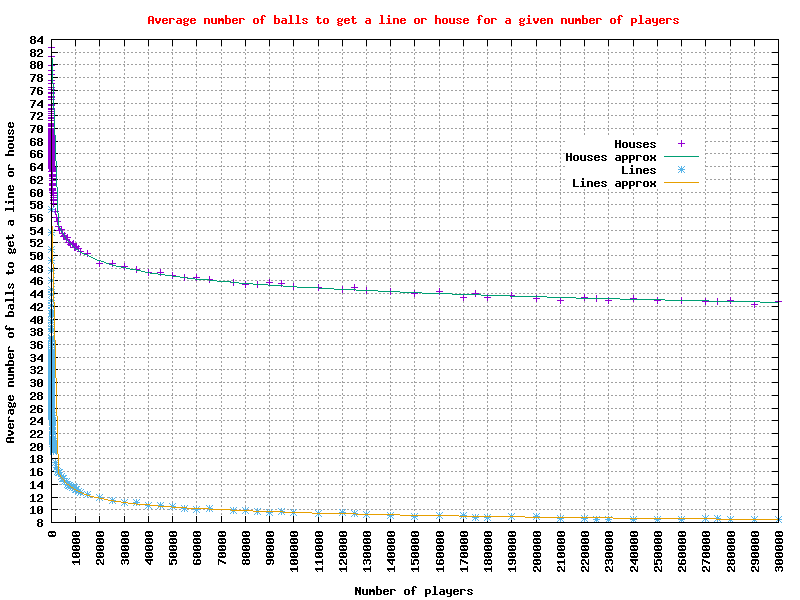
Graph of the average number of balls to get a “line” for 2 to 300,000 players
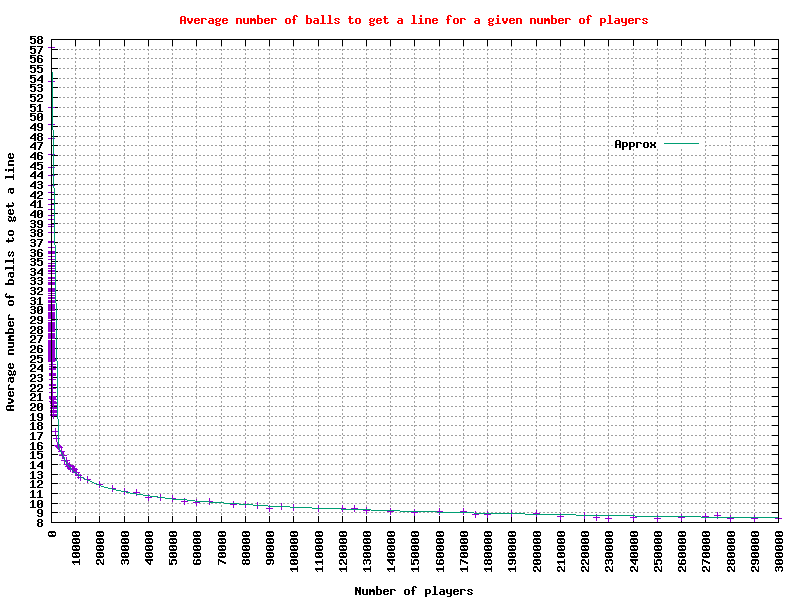
Approximation for 2 to 300,000 players for line
| Constant | Value |
|---|---|
| a | 274.5214 |
| b | 0.2369405 |
| c | 0.005209487 |
| d | 4.610405 |
Graph of the average number of balls to get a “house” for 2 to 300,000 players
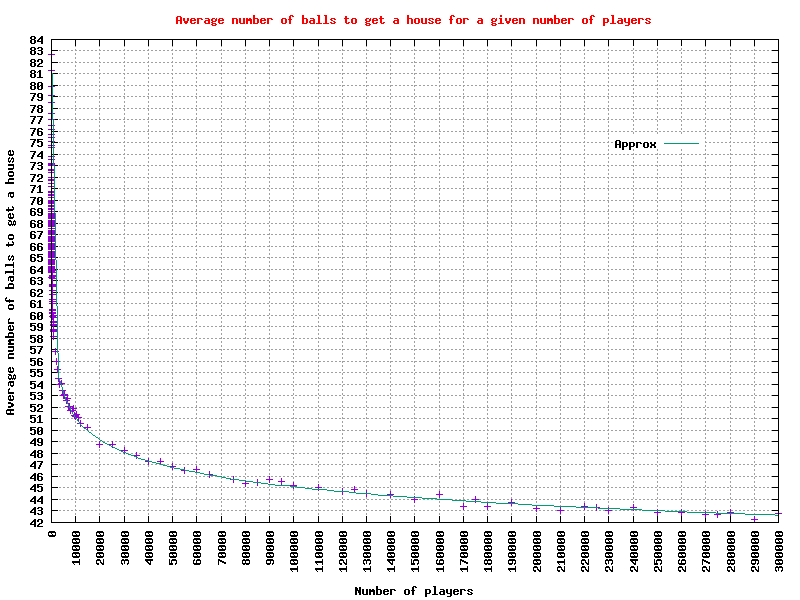
Approximation for 2 to 300,000 players for house
| Constant | Value |
|---|---|
| a | 179.4388 |
| b | 0.1217371 |
| c | 0.04500176 |
| d | 22.43121 |
Graph of the average number of balls to get a “line” or “house” for 2 to 50 players
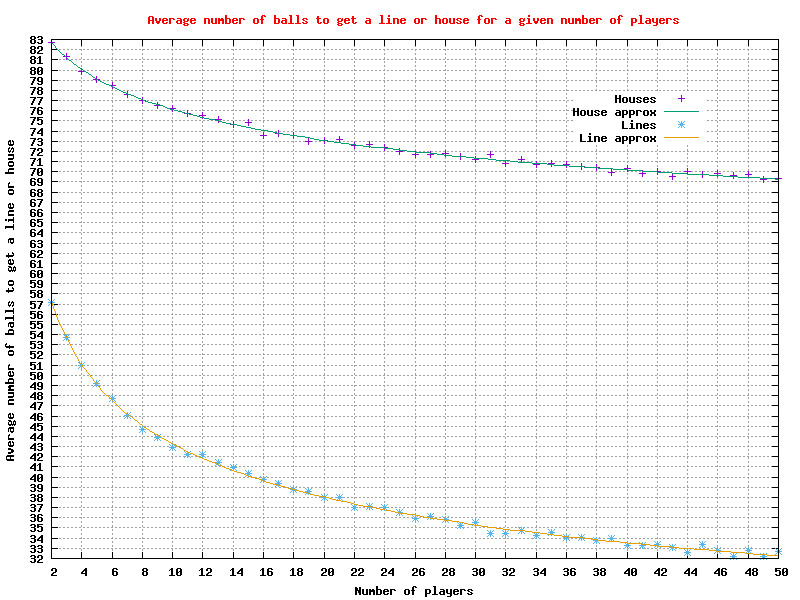
2.2 Graphs of the average number of balls to get a “line” or “house” (together) for 2 to 200 and 300,000 players
Graph of the average number of balls to get a “line” or “house” for 2 to 200 players
Graph of the average number of balls to get a “line” or “house” for 2 to 300,000 players
There is a CSV file with the data for the above graphs. We are collecting new data
There is a CSV file with the data for the above graphs:
We are collecting new data: